Senior Data Engineer
Anthony Sottile
Building enterprise data platforms, AI-powered analytics, and interactive experiences that turn complex data into decisive action.
About Me

I'm a data engineer who loves building things end-to-end — from designing lakehouse architectures that wrangle millions of rows, to crafting the React dashboards executives actually enjoy using. My sweet spot is turning messy, siloed data into governed platforms that drive real business decisions.
Before enterprise data, I built a baseball analytics SaaS and led analytics for USC Baseball. I still bring that same competitive, scrappy energy to every pipeline and dashboard I ship.


Data Sources Integrated
Executive Dashboards
Opportunities Surfaced
Pipeline Performance Gain
University of Southern California
B.S. Business Administration / Finance · Minor in Applied Analytics · GPA: 3.53
Dean's List · Cum Laude · USC Men's Basketball · USC Baseball
Technical Skills
Click a skill to see where it was used
Languages
Data Engineering
Cloud & DevOps
AI & ML
Visualization
Experience
TIDI Products – The Jordan Company
- Led enterprise BI strategy and vendor due diligence, selecting and architecting Microsoft Fabric as the company's analytics platform; designed medallion data architecture integrating 15+ sources (IBM Db2 ERP, Salesforce, EDI) into a governed foundation supporting 30+ executive dashboards.
- Partner with Finance, Sales, and Supply Chain leadership to transform complex business challenges—including multi-tier distributor/end-user relationships, GPO contract structures, and manufacturing cost allocation—into scalable data products that drive enterprise decision-making.
- Led greenfield build of the company's first enterprise data platform from scratch, architecting storage and compute layers, establishing foundational data products and standardized ETL pipelines across 15+ legacy systems (IBM Db2, AS/400, Salesforce).
- Developed and optimized PySpark/Spark SQL ELT pipelines leveraging distributed computing and Delta Lake (Parquet) storage, reducing legacy data refresh from 6+ hours to under 45 minutes and enabling daily executive reporting previously impossible with batch constraints.
KPMG LLP
- Led development of a digital command center for a $20B utility company; integrated SAP business warehouses into PowerBI delivering C-suite dashboards for capital spending, workforce productivity, and project delivery KPIs.
- Built Core Schedules, an automated M&A due diligence product using PowerBI REST APIs and Databricks—cutting insurance/payments deal report generation from hours to minutes.
CloudHack.AI
- Founded CloudHack, a sports analytics SaaS serving 2 D1 college teams; architected data pipelines ingesting player performance and statistical data at scale, delivering predictive insights via Azure, Databricks, and PowerBI that contributed to a 34-23-1 record and our client's first 30-win season since 2015.
- Architected end-to-end data infrastructure on Databricks and PostgreSQL: built dbt transformation models and PySpark ETL from FTP/NCAA sources to Azure Blob Storage, integrated OpenAI API for personalized coaching insights, and designed canonical datasets powering interactive dashboards.
USC Athletics (Baseball & Basketball)
- Led student analytics team processing high-frequency Trackman player tracking data (velocity, spin rate, positional metrics) for 55 games; built automated data pipelines and self-serve dashboards enabling coaches to analyze player performance in real-time.
Data Pipeline Architecture
Interactive medallion lakehouse architecture built at TIDI Products
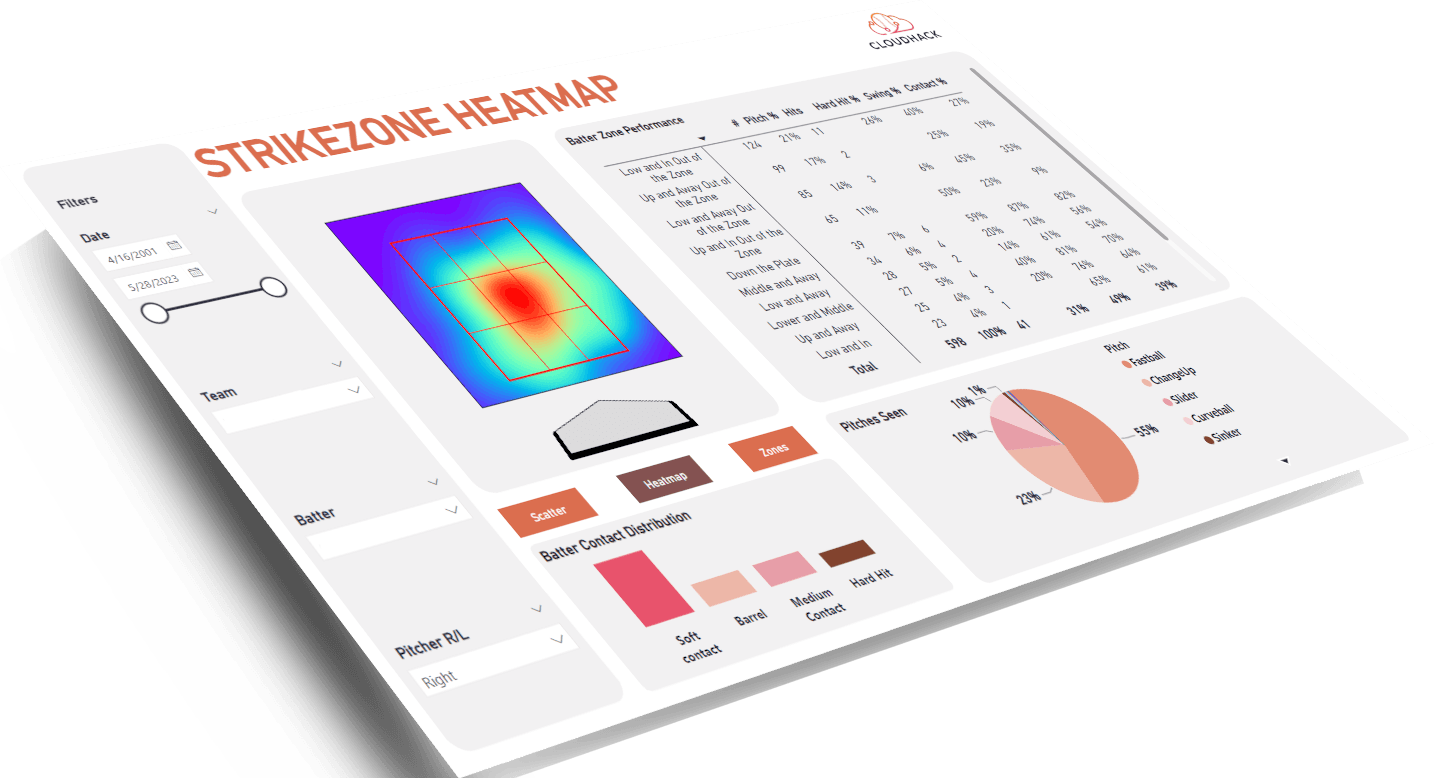
Baseball Analytics Dashboard
AI-powered scouting reports built for D1 college teams at CloudHack.AI
Pitch Velocity Distribution
Batting Average Trend
Player Skill Profile
Strike Zone Heatmap
3D Pitch Spin Lab
Rendered with React Three Fiber + Three.js. The baseball uses a procedural seam texture. Spin axis and gyro values orient the 3D axis/ring, while spin rate drives rotation speed for each pitch.CloudHack-style side-by-side spin comparison with interactive 3D movement.
Default View: angled perspective for easiest spin inspection.
Velocity
98.1 mph
Spin Eff
86%
IVB
11.8 in
Velocity
85.5 mph
Spin Eff
83.6%
IVB
1.6 in
Quick Comparison
Each card compares Pitch A vs Pitch B for one metric. Delta is calculated as B - A. Velocity, IVB, and HB use the selected pitch movement profile; spin rate reflects raw RPM from the same selected pitch records.Spin Rate
A2236.7 RPM
B1958.7 RPM
-278.0 RPM
Velocity
A98.1 mph
B85.5 mph
-12.6 mph
IVB
A11.8 in
B1.6 in
-10.2 in
HB
A2.9 in
B-0.6 in
-3.5 in
Star Schema Explorer
Conformed dimensional models for financial, commercial, manufacturing, and baseball analytics
Side Projects
Personal projects built on nights and weekends
ClawBot Deploy
One-click OpenClaw deployment platform. Deploy your personal AI assistant to Azure in minutes with a premium SaaS dashboard.
CloudHack Bets
AI-powered betting analytics platform with real-time arbitrage detection, Kelly Criterion sizing, and an LLM mathematician chat.
CloudHack Lead App
AI-driven outreach CRM with autonomous agents that handle prospecting, follow-ups, and response classification via a Kanban pipeline.
Ask My AI Assistant
Powered by OpenAI — ask anything about my experience, skills, or projects
Try one of these to get started:
Let's Connect
I'm always open to discussing data engineering, analytics, or new opportunities.
Download Resume